
(This Walk-through was performed using Windows 10 and Oracle® VM VirtualBox 7.0.18)
I recently finished a research project that involved acquiring virtual memory dumps to use with the memory analysis tool Volatility. This prompted me to learn how to perform a memory dump of a VirtualBox VM which wasn’t as straight forward as I’d hoped. Unfortunately, my search didn’t produce as singular resource with complete walk-through so I’ve decided to take matters into my own hands and provide one here. Hopefully, this will ease your search if you are trying to do the same.
Obtaining a memory dump requires the use of VirtualBox’s VBoxManage debug tool, debugvm. According to Oracle’s webpage,
“debugvm commands are for experts who want to tinker with the exact details of virtual machine execution. Like the VM debugger described in The Built-In VM Debugger, these commands are only useful if you are very familiar with the details of the PC architecture and how to debug software.”
Thankfully, we won’t need that much expertise as we won’t be delving into software debugging here.
Step 1:
- Right click on the Oracle VM VirtualBox icon
- Mouse-over ‘More’
- Select ‘Run as administrator’ (Figure 1).

Step 2:
- Start the desired VM in VirtualBox and perform whatever measures you wish to capture in the memory dump
For my purposes, I was trying to capture forensic artifacts of the Sliver C2 framework created by BishopFox.
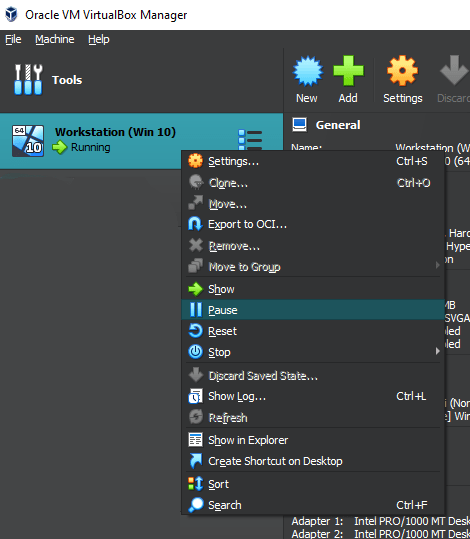
Step 3:
Once the desired environment or outcome has been achieved:
- Right click on the target VM and select ‘Pause’ (Figure 2).
Step 4:
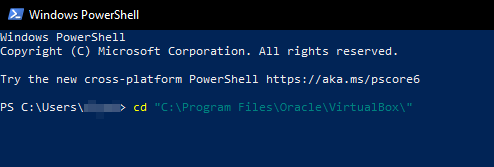
- Open a PowerShell terminal.
- Navigate to C:\Program Files\Oracle\VirtualBox\ (Figure 3).
- Execute the following command: .\VBoxMange.exe list vms (Figure 4).
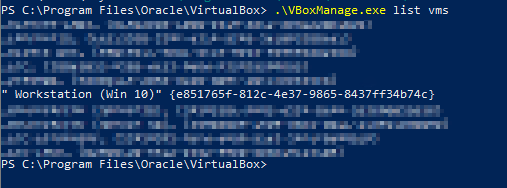
This will provide a list of all of the VirtualBox VMs and their respective unique identifiers as seen in Figure 4.
- Copy the UID of the desired VM.
Step 5:
- Execute the command following command: .\VBoxManage.exe debugvm UNIQUEID dumpvmcore –filename FILENAME.raw (Figure 5).

This will create a memory dump of your VM compatible for use with the forensic memory analysis tool Volatility.
Good Hunting-
